
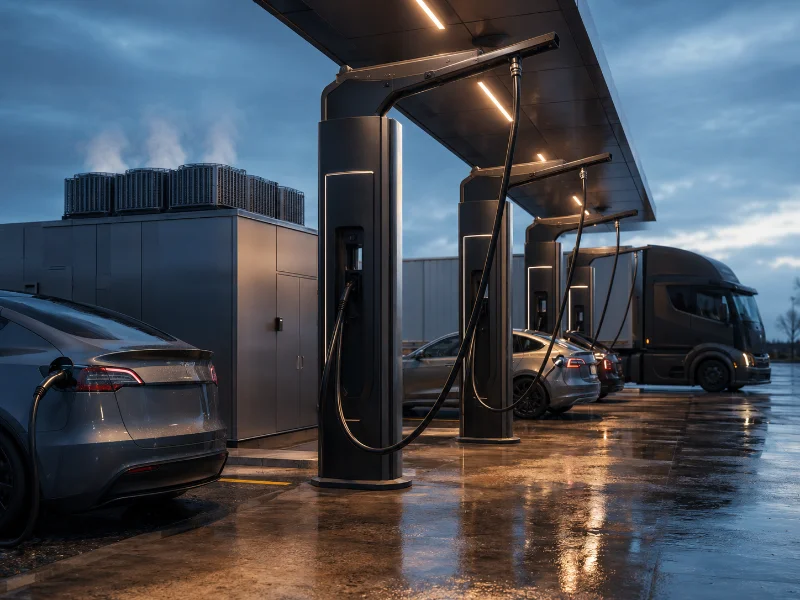
Liquid cooling technology for fast charging stations is applied in two places: the cable and connector assembly, and the power modules inside the cabinet. Which zone limits a site follows from continuous current, conductor resistance, design ambient and duty cycle, not from rated power alone. Published cable classes show the trade at a glance. At the same 1,000 V rating, one manufacturer lists 375 A continuously without cooling and 800 A with it. Cabinet losses track module efficiency and scale with output. Both zones are specified separately, and many stations cool only one.
| Item | Value or status (as of August 2026) |
|---|---|
| Connector terminal temperature rise | ≤50 K, as a type-test requirement under IEC 62196-1 |
| IEC 62196-1 current edition | Edition 5.0, published 2025-11-25; ≤690 V AC at ≤250 A, ≤1,500 V DC at ≤800 A |
| IEC 62196-3 current edition | Edition 3.0, published 2026-04-23; IEC TS 62196-3-1 folded in as normative Annex AA |
| IEC TS 63379 (megawatt coupler) | Edition 1.0, published 2026-01-28; ≤1,500 V DC, ≤3,000 A; thermal sensing, or thermal transport plus thermal sensing |
| IEC 61851-23-3 (MCS station side) | FDIS voting period closed 22 May 2026; confirm current status before citing |
| Published CCS cable classes, one manufacturer | 375 A continuous uncooled; 500 A and 800 A continuous cooled, all rated 1,000 V |
How Liquid Cooling Technology for Fast Charging Stations Works
A liquid-cooled charging station removes heat from the cable and connector assembly, from the cabinet power modules, or from both, depending on where the design runs out of margin. Architecture varies by product: separate cooling units per function, or one integrated thermal management system. A heat exchanger rejects the collected heat, most often an outdoor dry cooler, though refrigerated and evaporatively assisted designs exist. Delivered current, module efficiency and the site’s design ambient set how much heat the loop carries.
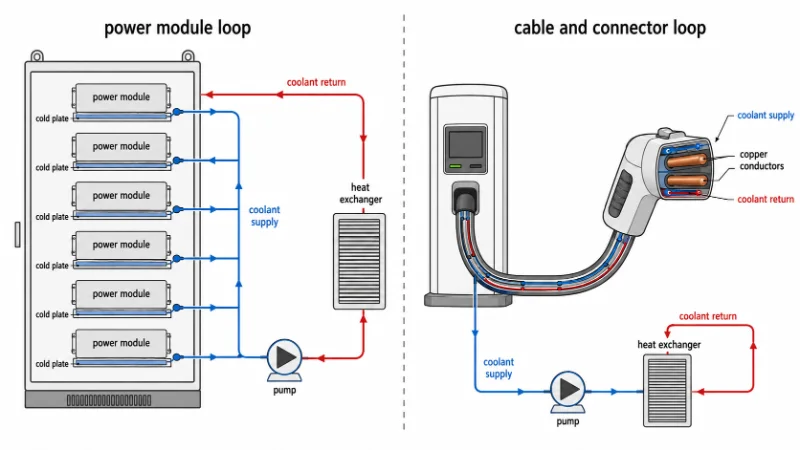
Instrumentation inside the loop drives the charger’s control logic. Phoenix Contact publishes a representative arrangement for its cooled CCS assemblies: Pt 1000 sensors in the connector, a water-glycol coolant, and coolant leak detection handled by the station’s insulation monitor before a session starts. When flow falls or coolant temperature rises, the controller cuts output current instead of letting contact temperature climb. The thresholds sit in commissioning data, not on a datasheet.
What the whole loop serves is a temperature rise above ambient, verified under declared test conditions. IEC 62196-1 sets a 50 K type-test requirement for terminal temperature rise in the charging connector. The same manufacturer’s footnote is explicit: a cooled cable’s permanent current rating depends on normative limits and on available cooling capacity together. Field behaviour answers to more than the type test, including surface temperature limits, the declared operating range and the station’s own monitoring.
When Cabinet Conversion Losses Dominate the Cooling Load
Cabinet conversion losses dominate the cooling load whenever module inefficiency produces more kilowatts than the cable and connector dissipate. Charger power alone will not settle that comparison. It takes the module’s measured efficiency map and the cable assembly’s resistance or thermal test data.
Waste heat inside the cabinet follows from efficiency alone: Q ≈ P × (1/η − 1). At 95% efficiency, a 480 kW cabinet dissipates roughly 25 kW. At 98%, the same cabinet dissipates roughly 10 kW, which moves cable, busbar and auxiliary losses into a very different relative position. Put your own numbers through the same expression: take the cabinet’s rated output, divide by your module’s full-load efficiency, then subtract the rated output.
Both efficiency figures come from a published thermal study of a 20 kW DC charging module. It reports about 96% at 45–55% load and 95% at full load. That curve belongs to the module studied. Modern silicon-carbide designs can sit higher, so the efficiency map has to come from the module you actually specify.
Cable and connector losses work differently, because conductor cross-section, contact resistance and cable length all enter. The shape is predictable: Joule heating scales with the square of current, so stepping a cable from 350 A to 500 A roughly doubles conductor loss at constant resistance.
| Heat zone | Dominant loss | What sets the magnitude | Depends on |
|---|---|---|---|
| Rectifier modules in cabinet | Switching and conduction losses | Output multiplied by (1/η − 1) | Measured efficiency map, load factor, module count |
| Cable conductors | I²R heating | Rises with the square of current | Cross-section, cable length, coolant flow rate |
| Connector contacts | Contact resistance across a small interface | Bounded by the type-test rise requirement | Contact plating and wear, mating force, ambient |
| Loop auxiliaries (pump, fans, controls) | Continuous parasitic draw | Small but always present | Pump head, fan control strategy, standby logic |
Size a cooling loop from the dispenser’s nameplate without checking where the module’s efficiency curve sits at full load, and the shortfall rarely announces itself as an alarm. It surfaces as unexplained current derating during the first heat wave. The investigation usually starts at the cable, because the cable is the part you can see.
Choosing Between Liquid and Air Cooling at a Charging Site
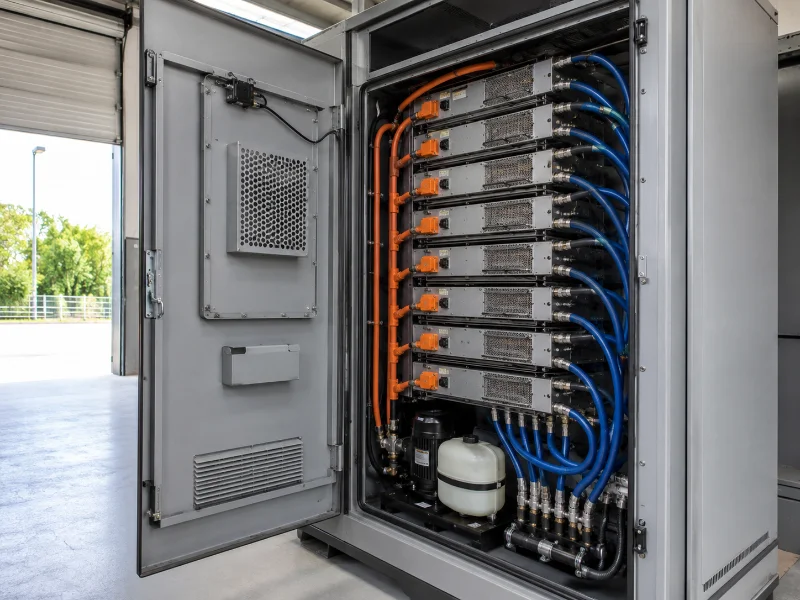
Liquid cooling earns its place at a charging site once continuous current, conductor cross-section and design ambient stop fitting an air-cooled path. No universal kilowatt figure marks that point. Duty cycle and allowable cable weight belong in the same decision. Published classes from one manufacturer make the trade visible at a single rated voltage: 375 A continuous without cooling, 500 A and 800 A continuous with it, all at 1,000 V.
The gap between those classes is the engineering question in compact form. At equal conductor resistance, going from 375 A to 800 A would raise I²R loss by a factor of about 4.5. Real assemblies do not hold resistance constant. The uncooled class reaches its rating through increased conductor cross-section instead, so the trade is cooling capacity against copper, which is how cable weight and handling enter a thermal decision. Cooled assemblies are marketed partly on lighter weight and easier handling. That matters wherever the public plugs in unassisted.
| Site profile | Typical starting point | Verify against |
|---|---|---|
| Workplace or destination DC, ≤150 kW, low simultaneous use | Air-cooled cable, air-cooled cabinet | Continuous current per outlet at design ambient; service access to filters |
| Highway or hub, 250–400 kW, back-to-back sessions | Cooled cable, with cabinet cooling decided from the module efficiency map | Sustained output at design ambient; coolant freeze point against the winter minimum |
| Enclosed or underground parking | Heat rejection routed outside the enclosure, cooling type per architecture | Local fire, ventilation and building code; noise limit at the property line |
| Depot or heavy-duty, megawatt class | Cooling on both cable and cabinet | Coupler per IEC TS 63379; coolant and interface compatibility with the vehicle side |
Each row is a starting point for a specification conversation. Simultaneity factor, power sharing, IP rating, dust and salt exposure, cabinet power density, redundancy and local code all move the answer. The charger OEM’s architecture also governs which zones a buyer can specify separately at all.
A workplace charger delivering 60 to 120 kW sits idle most of the day. A liquid loop there adds pumps, seals, coolant checks and a leak failure mode the site has no use for. The money belongs in the grid connection.
Cable cooling and cabinet cooling can be applied singly or in combination, depending on which zone reaches its limit first. Pairing a cooled cable with an air-cooled cabinet is a common mid-power configuration.
Cold Plate Design Variables for Charging Cabinet Power Modules
Cold plate performance in a charging cabinet rests on four interacting variables: coolant inlet temperature, flow rate against allowable pressure drop, channel geometry beneath the loss hotspots, and the interface between plate and module baseplate. Heat flux at the hotspot footprint, not the module’s total watts, decides how hard that geometry has to work.
Inlet temperature is set outside the cabinet. In a dry cooler running without evaporative assistance or refrigeration, coolant supply temperature stays above ambient dry-bulb by the cooler’s approach temperature. A plate validated at a 30 °C inlet will miss the same module temperature where the summer design ambient is 40 °C. The sizing input is therefore the site’s design ambient plus that approach.
The interface is where measured performance departs from simulation. Baseplate flatness, interface material thickness and mounting torque all move contact resistance. A plate that meets its target in analysis can still miss it once the module baseplate falls outside the flatness tolerance the interface material was chosen for.
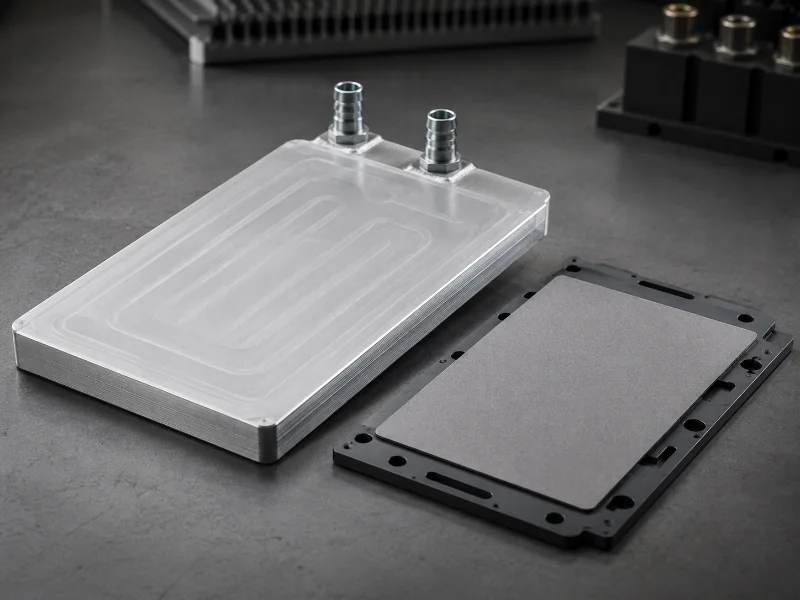
A cold plate specification for charging cabinets should state, at minimum:
- Heat load per module and heat flux at the hotspot footprint, with the number of modules sharing one plate or one manifold
- Target thermal resistance from coolant to module baseplate, and the baseplate temperature limit it protects
- Design flow rate, allowable pressure drop, and flow distribution tolerance across parallel modules on a shared manifold
- Coolant selection, glycol concentration and inhibitor package, plus every wetted material — aluminium plates paired with copper or brass fittings open a galvanic corrosion path the inhibitor has to cover
- Proof pressure, acceptable leak rate, and the test method that demonstrates both
- Construction route, since brazed, friction-stir-welded and tube-in-plate designs differ in achievable channel geometry, internal cleanliness and repairability
Two of these lead the rest. Coolant chemistry and design inlet temperature lock first, because every downstream calculation takes them as inputs, and because plate material, joining method and port fittings resist economical change once tooling exists. Flow rate and pump speed are set points and stay adjustable during commissioning. We verify pressure drop and flow distribution across parallel modules at the specified flow before plate geometry is frozen.
Verifying a Liquid-Cooled Charging Station Before It Ships
Acceptance testing for a liquid-cooled charging station covers three items that field failures trace back to: temperature rise at rated current, loop integrity under pressure, and controller behaviour when cooling performance drops.
The temperature rise test runs the assembly at rated current until temperatures stabilise, then compares terminal rise against the applicable type-test requirement at the declared conditions. Report conditions matter as much as the result. A test at 20 °C ambient says little about a site that design-points at 40 °C.
Loop integrity starts as a pressure and leak check at ports and couplings. It also covers whether coolant leakage stays detectable in service, and some connector designs use the station’s insulation monitor for exactly that. Outdoor cabinets swing between night and day temperatures. Quick-connect couplings and hose retention at the plate ports repay a second look there, because thermal cycling works on seals long before it reaches the plate.
Controller behaviour is the check most often skipped. Under the charger manufacturer’s approved validation procedure only, confirm that a low-flow or high-inlet-temperature condition produces a controlled reduction in output current. Then log flow, inlet and outlet temperature and module temperature across a full session, so the derating threshold is documented rather than discovered on site.
Charging Interface Standards and What Changed in 2025–2026
Four IEC documents govern the temperature-rise and thermal-management requirements a fast charging station is specified against, and three of them changed edition between November 2025 and April 2026. All four sit in the IEC/CCS framework.
IEC 62196-1:2025, Edition 5.0, published 25 November 2025. The general-requirements standard for EV plugs, connectors, inlets and cable assemblies, covering ≤690 V AC at ≤250 A and ≤1,500 V DC at ≤800 A. It replaces the 2022 fourth edition. Action: confirm which edition the connector type-test report cites, because the temperature-rise clause carries any derating strategy.
IEC 62196-3:2026, Edition 3.0, published 23 April 2026. Dimensional compatibility for DC and AC/DC couplers, with the content of IEC TS 62196-3-1, the thermally managed coupler specification, folded in as normative Annex AA and ratings increased for all configurations. Action: for cooled cable assemblies, ask for evidence against this edition, since the technical specification it absorbed no longer stands alone.
IEC TS 63379:2026, Edition 1.0, published 28 January 2026. Covers connectors, vehicle inlets and cable assemblies for megawatt DC charging up to 1,500 V DC and 3,000 A, for systems using thermal sensing, or thermal transport plus thermal sensing. It specifies the coupler and cable assembly, not a complete station. Action: if heavy-duty vehicles fall inside the equipment’s service life, check whether the interface follows this specification, since a CCS-only cabinet cannot be re-rated to it.
IEC 61851-23-3, station-side requirements for megawatt charging. The FDIS voting period ran to 22 May 2026. Action: verify current publication status on the IEC page before naming an edition in a purchase specification.
Deciding Where the Cooling Budget Goes in a Fast Charging Station
Liquid cooling technology for fast charging stations earns its complexity in whichever zone reaches its limit first. Two documents decide which zone that is: the module efficiency map and the cable assembly’s thermal data. Cooling capacity converts into continuous current, and both zones lose headroom as design ambient rises.
Cooling verified only at bench inlet temperature tends to look adequate until the first heat wave, when rejection capability and connector rise allowance run out on the same afternoon. Flow rates, channel geometry and coolant choice still depend on the module loss map and the design ambient of the specific site.
If your cabinet output is 400 kW or more and your summer design ambient sits above 35 °C, place the module loss map beside the inlet temperature your rejection unit can realistically deliver. That pairing is what we align Water Cooling Plates against before geometry is fixed. If the dispenser stays under 150 kW with low simultaneous use, keep the air-cooled cabinet and spend the budget on the grid connection.
FAQ
Does a liquid-cooled cable charge a car faster?
No. The vehicle’s battery management system sets the accepted current; cooling only removes the cable and connector as the limiting factor.
Which coolant do charging station loops use?
Water-glycol mixtures are common, and dielectric fluids appear in some designs. Swapping one for another after commissioning is the move to avoid: viscosity and specific heat both shift, which pulls flow rate and pressure drop away from the validated point.
How often should coolant be checked?
Follow the equipment manufacturer’s service interval. Between services, trend flow at constant pump speed.
Is a liquid-cooled station quieter than an air-cooled one?
Usually at the dispenser, since most heat rejection moves to a unit you can site away from the parking bay. That unit still has to go somewhere, and where it goes is a site layout decision made early.
Can an air-cooled charger be retrofitted to liquid cooling?
Rarely as a field retrofit. Modules must be plate-mounted, the cabinet needs loop routing and a rejection unit, and control firmware has to read flow and coolant temperature.