
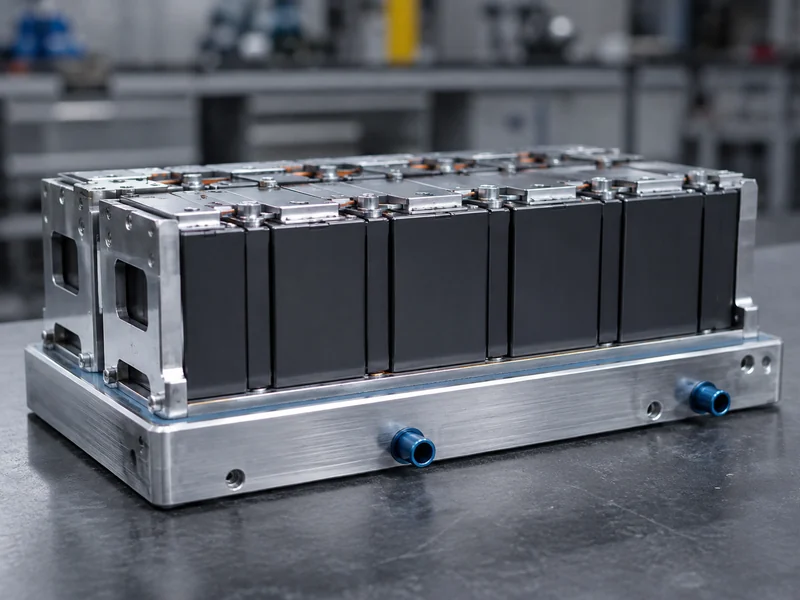
Thermal interface material resistance is the slice of the cell-to-coolant heat path that assembly choices control. In a battery pack it affects how much of the heat a cell produces actually reaches the cold plate. Every mechanical joint between a cell, a module wall, and a cooling structure carries microscopic air gaps. Air conducts heat roughly two orders of magnitude worse than a filled joint. The interface material exists to replace that air, but it never removes resistance entirely; it substitutes a lower, designable resistance for an uncontrolled one.
For battery-pack thermal and product engineers, the practical question is not “which TIM has the highest conductivity” but “what interface resistance will this joint show at my gap, pressure, and flatness.” This article defines interface resistance, separates the three quantities that datasheets tend to blur, walks through the variables that actually move the number, and explains how the value is measured. It does not cover coolant-side resistance, cell chemistry, or pack-level runaway modeling; those sit outside the interface itself.
What Thermal Interface Material Resistance Actually Means
Treat interface resistance as a system property of the assembled joint, not a fixed number that travels with the material. When a TIM is placed between a cell or module and a cooling surface, the total opposition to heat flow has three parts: the bulk resistance of the material itself, the contact resistance where the TIM meets the upper surface, and the contact resistance where it meets the lower surface. Sum those three and you have what most datasheets call thermal impedance.
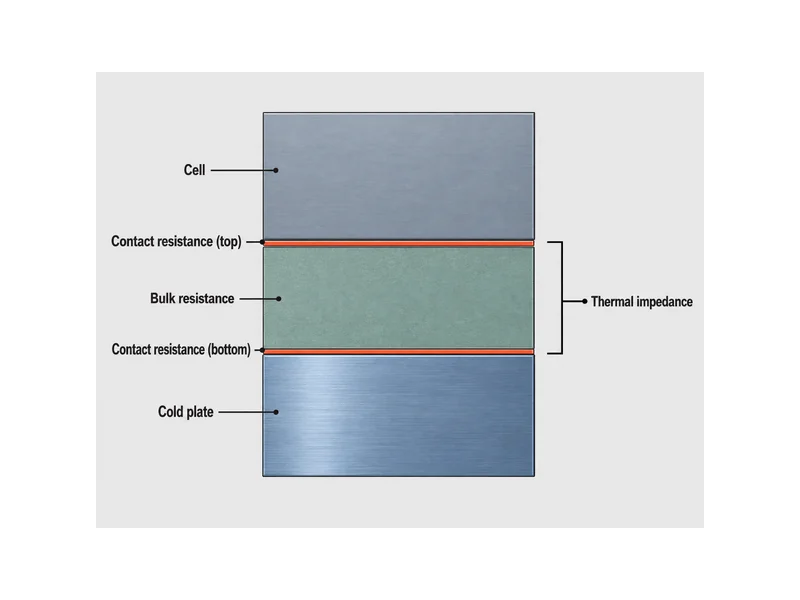
Bulk resistance scales with how thick the applied layer is and how well the material conducts. A thicker layer lengthens the path heat must travel, so bulk resistance rises with bond line thickness and falls with conductivity. Contact resistance, by contrast, comes from imperfect touching: real surfaces are rough and slightly non-flat, so the actual contact area is smaller than the apparent area, and the shortfall shows up as a temperature drop right at the boundary.
Air is the reason the material is there at all. The thermal conductivity of air sits around 0.02 to 0.03 W/m·K, far below that of a conforming interface material, so replacing trapped air with one substantially lowers the thermal resistance at the joint. What remains after that substitution is the interface resistance you design around, and it is worth tracking across the cells in a pack, because uneven joints create uneven cell temperatures.
Thermal Resistance vs. Thermal Impedance vs. Contact Resistance
Confusing these three terms is an easy way for TIM selection to go wrong, because they use different units and answer different questions. Thermal conductivity is an intrinsic material property, independent of shape or size, expressed in W/m·K. Thermal resistance and thermal impedance depend on geometry, so they only describe a specific joint at a specific thickness and pressure. Reading a conductivity figure and assuming it predicts joint performance skips the two contact resistances that geometry introduces.
| Quantity | What it describes | Typical unit | Depends on geometry? |
|---|---|---|---|
| Thermal conductivity | Intrinsic ability of the material to conduct heat | W/m·K | No |
| Thermal resistance | Opposition to heat flow through a defined layer | °C/W or °C·cm²/W | Yes |
| Contact resistance | Temperature drop at each TIM-to-surface boundary | °C·cm²/W (or mm²·K/W) | Yes |
| Thermal impedance | Bulk resistance plus both contact resistances | °C·cm²/W | Yes |
Area-normalized units are what let you compare parts on the same footing. Because a bare thermal resistance in °C/W depends on how much area is carrying the heat, engineers usually work in area thermal resistance or impedance, in °C·cm²/W or the equivalent mm²·K/W. That strips out the footprint, but it removes only the area variable: two impedance figures still compare cleanly only when their method, bond line, pressure, temperature, and contact surfaces match. When a supplier quotes a single impressive conductivity but no impedance at a stated pressure and thickness, treat the joint performance as unverified rather than assuming it from the material property.
The Variables That Drive Interface Resistance
Four variables move interface resistance more than the headline conductivity does, and each has a matching thing to verify. These four predict a pack’s cell-temperature uniformity far better than the headline conductivity number.
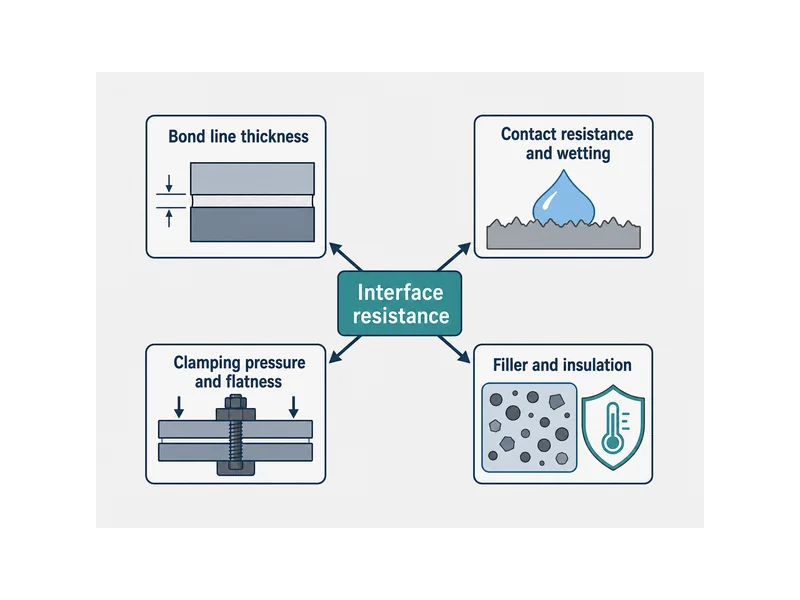
- Bond line thickness (BLT). Thinner bond lines lower bulk resistance because heat travels a shorter path, so datasheet impedance should always be read against the BLT it was measured at. The achievable minimum is limited by the filler particle size, warpage, and how much the material can absorb surface topology, so the thinnest workable bond line follows from the material and the joint; there is no universal target.
- Contact resistance and wetting. Lower contact resistance depends on the material conforming to both surfaces, which is why a soft, liquid-dispensed gel can wet a rough face at low pressure while a firm pad may need clamp load to do the same. Verify conformance at the pressure your assembly can actually apply, not at a lab pressure.
- Clamping pressure and flatness. Higher assembly pressure and flatter mating faces both shrink the air-filled fraction of the joint and pull contact resistance down. Confirm the pressure a cell can tolerate before assuming a pad’s low-impedance rating, because cells and busbars limit how hard a joint can be squeezed.
- Filler system and insulation need. Conductivity comes from loading a polymer with conductive particles such as alumina, aluminum, or boron nitride, and the filler choice interacts with whether the joint must also be an electrical insulator. Boron nitride, for example, supports insulation while carrying heat, which matters when the interface doubles as dielectric isolation between a cell and a grounded plate.
A useful discipline is to write down the joint before choosing a product: gap and its tolerance, the pressure the assembly can apply, the flatness of both faces, and whether the layer must insulate. Those four inputs predict interface resistance better than any single material rating, and they turn a conductivity spec sheet into an actual joint estimate.
Measuring TIM Resistance to ASTM D5470
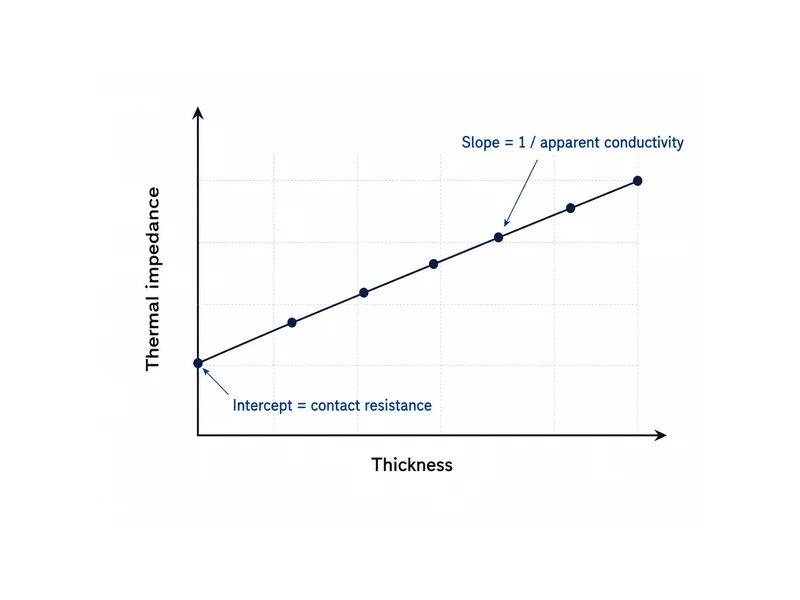
You measure interface resistance; you do not calculate it from conductivity. The standard reference method is ASTM D5470. Per the ASTM D5470 steady-state method, a sample is clamped between two instrumented meter bars, heat is driven through it, and the temperature gradients give the thermal impedance of the joint. Running the same material at several thicknesses and plotting impedance against thickness separates the two contributions: the inverse of the slope is the apparent thermal conductivity, and the intercept at zero thickness is the sum of the two contact resistances. That intercept is exactly the part conductivity alone can never tell you.
The measurement is condition-bound, which is why a number without conditions is hard to use. Reported impedance depends on the pressure and temperature difference held during the test, so two datasheets are only comparable when their test pressure, thickness, and temperature are stated. Treat an impedance figure as valid for the conditions printed next to it, and re-verify at your own clamp pressure.
Published measurements give a sense of scale for real interface resistance. A peer-reviewed study of thermal interface materials used in electric-vehicle charging-inlet monitoring measured interface contact resistance of roughly 0.1 to 0.17 (cm²·K)/W for materials rated around 3.9 to 4.5 W/(m·K), against a broader comparison range near 0.01 to 0.1 (cm²·K)/W. The takeaway for pack work is not the exact figures but the pattern: contact resistance is a meaningful fraction of the total, and a higher bulk conductivity does not by itself demonstrate a lower contact resistance — that has to be measured at the same surfaces, bond line, temperature, and clamp pressure.
Interface Resistance in Battery-Pack Heat Paths
In a battery pack, interface resistance can consume thermal margin along the cell-to-coolant path, so the TIM form factor should follow the joint rather than a target conductivity. Cylindrical, prismatic, and pouch formats present different gaps, flatness, and assembly stresses to the cold plate. The interface material has to hold low resistance across every cell so the coldest and hottest cells stay close together. Matching the material to the gap and to the pressure the cells can take is the decision that keeps interface resistance uniform, and it is where Trumonytechs’ matched TIM solutions and cooling components fit the cell-to-coolant design.
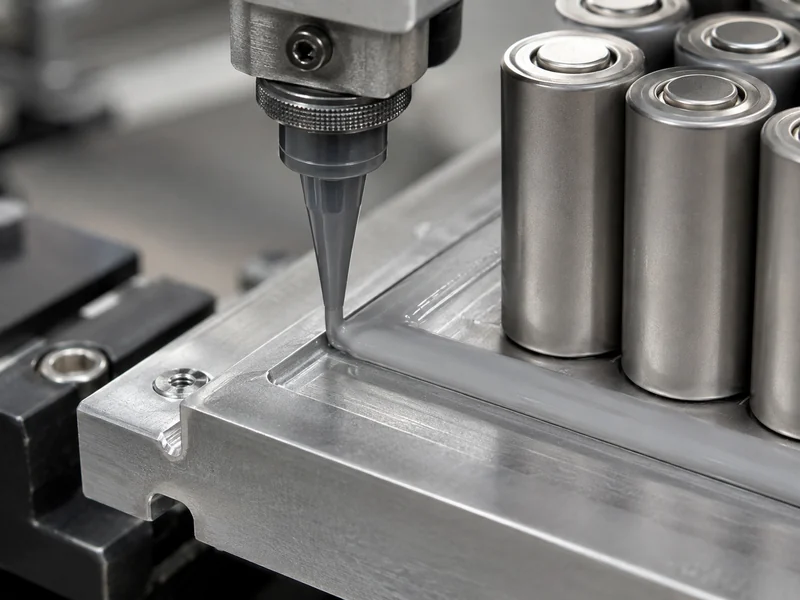
Form factor choices map to interface behavior in predictable ways. A conformable gap filler suits variable or larger gaps and tolerates cell-to-cell tolerance stack-up without needing high clamp load; a thinner pad or phase-change layer suits flat, well-controlled joints where low BLT drives impedance down; a thermal gel dispenses to fill uneven faces at low pressure; and a structural adhesive adds bonding when the joint must carry load as well as heat. Where the interface must also isolate a cell electrically, the filler and thickness are chosen for dielectric strength alongside resistance; when meeting a required dielectric strength calls for added thickness, that raises the bulk portion of resistance.
Durability belongs in the same decision. A joint that starts with low resistance can drift upward if the material takes a compression set after heat aging or pulls away under thermal cycling, so validating retained thickness and impedance after aging matters as much as the initial rating. Specifying against the aged condition, not the fresh one, is the industrial habit that keeps interface resistance honest over a pack’s service life.
Conclusion
Carry away one idea: thermal interface material resistance is a joint property built from bulk resistance and two contact resistances, so a high conductivity figure alone never predicts how a cell-to-coolant joint will behave. Separate the quantities, read impedance at its stated bond line and pressure, and size the material to the gap, flatness, assembly stress, and insulation need of the specific joint. The point most often missed is the contact-resistance intercept: a more conductive material does not by itself lower it, because wetting, hardness, surface conformance, and pressure govern that boundary. So it has to be re-measured whenever the material or joint changes, and in a pack it is what can turn an even set of cells into an uneven one. Confirm impedance at your own clamp pressure and after heat aging, re-verify it across the full cell-to-coolant boundary, and the interface is far less likely to remain the weak link in the heat path.
FAQ
What bond line thickness gives the lowest thermal resistance for a gap filler?
There is no single best bond line thickness for a gap filler. A thinner bond line lowers the bulk portion of resistance for a given material, but the achievable minimum is set by the gap and its tolerance, the filler particle size, the surface topology, and the clamp load the assembly can apply — and it only helps if the material still fully wets both faces at that thickness. Specify the thinnest bond line that stays within those limits rather than a fixed number.
Thermal resistance or thermal impedance: which should I compare when selecting a TIM?
Compare thermal impedance at a stated bond line and pressure, because it includes both the bulk resistance and the two contact resistances that a conductivity or bulk-resistance figure leaves out. Use area-normalized units, °C·cm²/W or mm²·K/W, to remove footprint differences, and still compare only figures measured at a comparable bond line, pressure, and temperature, since normalization does not cancel those variables.
How can I lower contact resistance without increasing clamping pressure?
Choosing a more conformable material, such as a dispensed gel or a softer gap filler, lowers contact resistance by wetting rough faces without extra clamp load. Improving the flatness of both mating faces also shrinks the air-filled fraction of the joint, which lowers contact resistance without adding clamp load.
How is TIM thermal resistance measured?
Thermal resistance is measured under the ASTM D5470 steady-state method, which clamps the sample between instrumented bars and derives impedance from the temperature gradient. Testing several thicknesses and plotting impedance against thickness yields apparent conductivity from the slope and the combined contact resistance from the zero-thickness intercept.
Further Reading
- Determination of Contact Resistance of Thermal Interface Materials Used in EV Charging Inlets — peer-reviewed study (MDPI Sensors). Supports the measured contact-resistance ranges and the point that contact resistance is a meaningful fraction of total interface resistance.
- Thermal Impedance vs. Thermal Conductivity — technical reference. Explains the ASTM D5470 impedance-versus-thickness method and why conductivity alone does not describe a joint.
Related Articles
- What Does Thermal Paste Do? — Shows how thermal paste fills microscopic voids at the chip-to-cooler interface to cut thermal resistance, and how clamp force and flatness affect coverage.
- What Is Silicone Thermal Compound? Uses & Key Factors — Explains how a silicone compound’s conductive fillers fill surface gaps to lower thermal resistance, with guidance on where to use it.
- Thermal Interface Materials Types & Characteristics — Compares TIM types such as pastes, pads, phase-change films, and gap fillers and the characteristics that set each one’s interface behavior.
- Guide To Thermal Interface Materials — A primer on what TIMs are, the main material types, and the factors that guide TIM selection for better heat transfer.
- Innovations in TIMs for Enhanced Thermal Management of Electronics — Surveys newer TIM developments and how they improve heat transfer between hot components and heat sinks.